During the decade that Investment Executive (IE) has produced the Regulators’ Report Card, compliance officers and company executives have never shied away from giving their honest opinions about the industry’s watchdogs.
How regulators were rated in the past decade
How regulators were rated in the past decade
1. Investment Industry Regulatory Organization of Canada
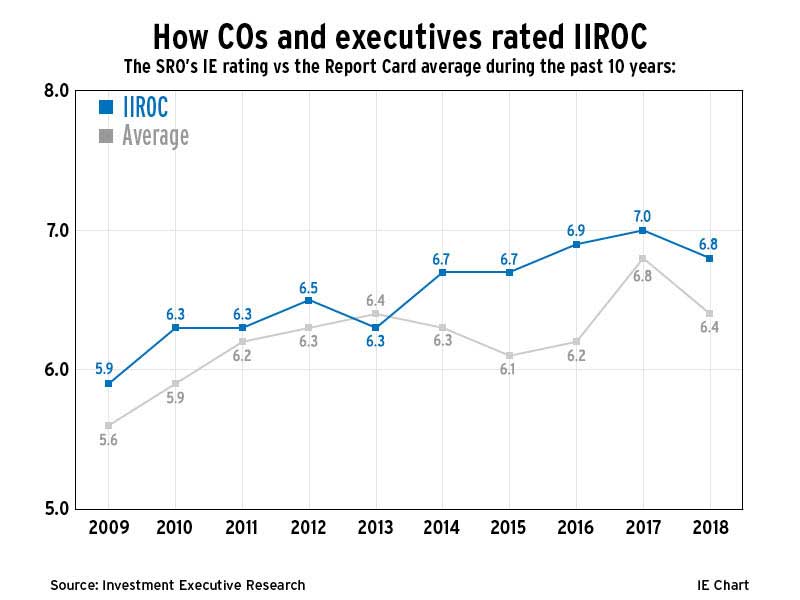
IIROC has seen some ups and downs in its IE rating over the past 10 years, but the SRO has beaten the Report Card average more often than not. After débuting with an IE rating of 5.9 in 2009, IIROC’s rating improved steadily over the next few years despite a slight decline in 2013. Last year proved to be a high point for the SRO with an IE Rating of 7.0, thanks largely to IIROC’s efforts in several areas, including efforts to communicate its priorities to members. IIROC saw a slight decline in its IE rating this year as survey participants took issue with a lack of board representation for dealers, particularly smaller shops.
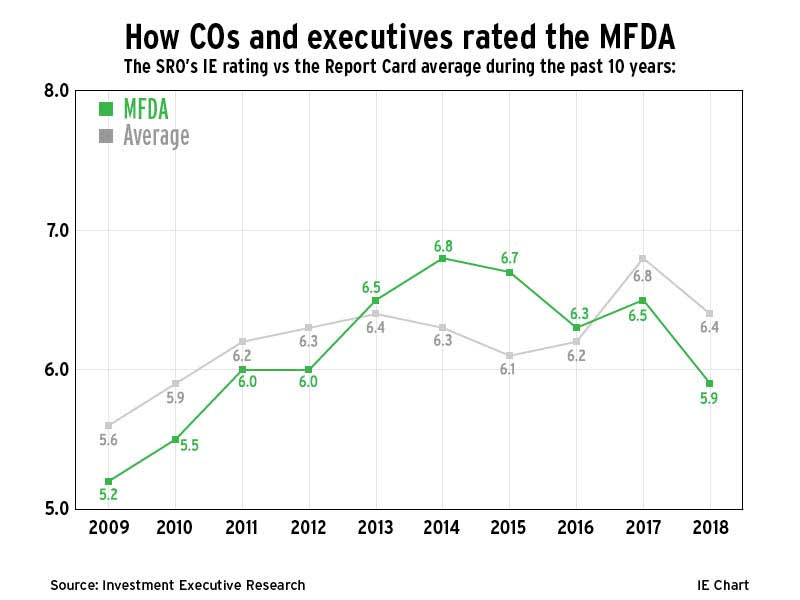
The MFDA’s IE rating has been a little rocky since the first Report Card was published in 2009. After a steady rise from the initial IE rating of 5.2, the MFDA’s ranking peaked at 6.8 in 2014, when survey participants noted improvements in the SRO’s treatment of small firms. Since then, the MFDA’s IE rating has declined to 5.9 in 2018, well below the Report Card average, after ratings declined significantly, by half a point or more, in 12 of the 19 categories in which it was rated. The big concern for MFDA members this year is the lack of representation on its board of directors as well as the SRO’s seemingly inflexible approach to audits.
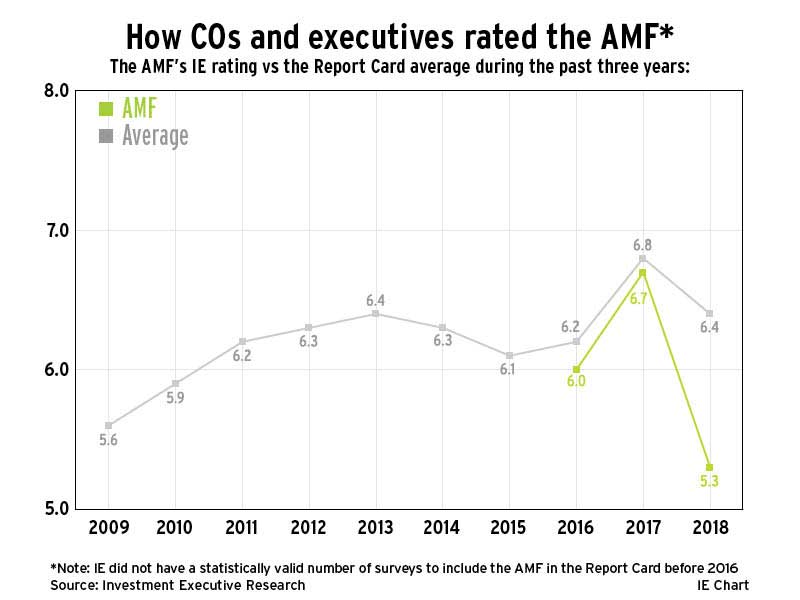
The AMF is the most recent addition to the Report Card main table — and its IE rating has been the most volatile. However, that volatility should be taken with a grain of salt as it can be attributed, in part, to the provincial regulator’s relatively small sample size. The AMF first appeared in the Report Card in 2016, with a rating of 6.0. The rating then rose to 6.7 in 2017, with registrants noting improvements in the regulator’s approach to investigations and disciplinary actions. This year, the AMF saw a significant drop in its IE rating to 5.3 with survey participants taking issue with the AMF’s inflexible approach to audits.
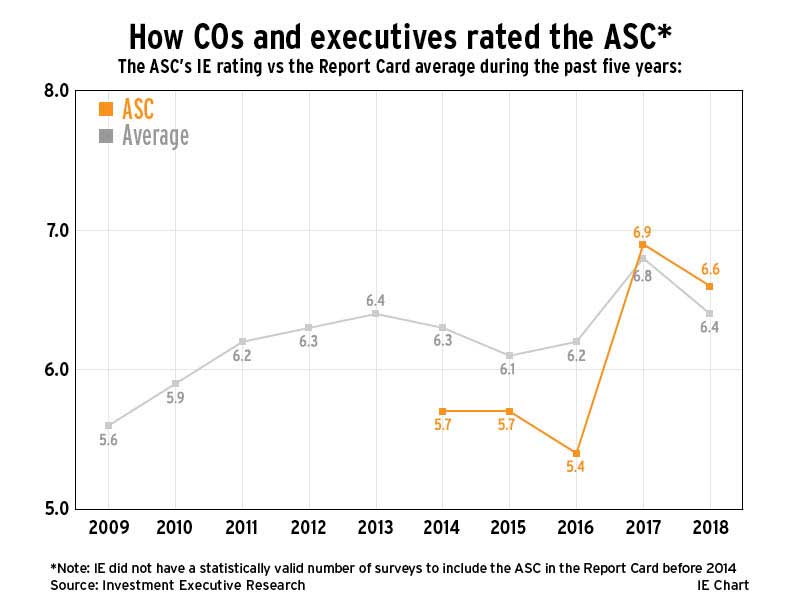
The ASC has recently enjoyed fairly strong IE ratings after posting below-average ratings in its first three years in the Report Card. In 2014, the ASC received an IE rating of 5.7. The ASC’s rating then bottomed out in 2016 at 5.4, when survey participants took the regulator to task for its seemingly unfair policy decisions and ineffective communication. The ASC then experienced a change of fortune in 2017 when it hit an above-average rating of 6.9 as survey participants praised the regulator for its efforts in soliciting comment on new rules and policies. The ASC held on to its above-average rating this year despite a slight dip to 6.6.
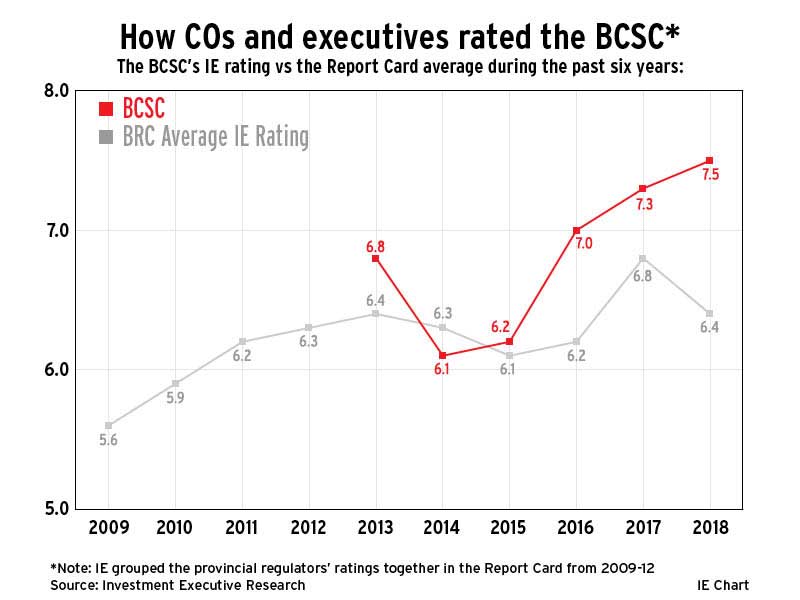
The BCSC has often been the highest-rated regulator since its Report Card début in 2013, with a rating of 6.8. Despite this initial strong showing, the BCSC saw its rating drop to 6.1 in 2014. That year, survey participants said the BCSC didn’t seem to care about registrants’ regulatory burden. The BCSC turned things around quickly and received an IE rating of 7.0 in 2016. The regulator hasn’t looked back since; in fact, its IE rating of 7.5 this year is an all-time Report Card high. The BCSC received high praise from survey participants this year for the fairness of its policy decisions as well as its fair and efficient approach to audits.
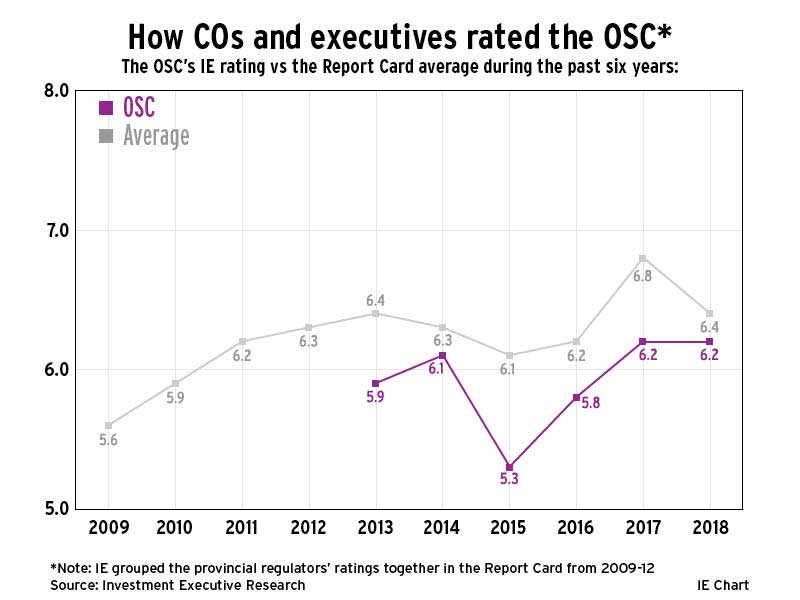
The OSC’s IE rating has been fairly steady, if below average, in the six years it has appeared in the Report Card. The sole exception was in 2015, when the OSC received its lowest IE rating of 5.3, as survey participants complained about a lack of transparency in the OSC’s investigations and the regulator’s seemingly dismissive attitude toward the regulatory burden registrants face. Things began to turn around the following year, and the OSC received its highest IE rating of 6.2 in 2017, with COs and company executives noting improvements in many areas, including the OSC’s more collaborative approach to audits. That rating has remained the same in 2018.
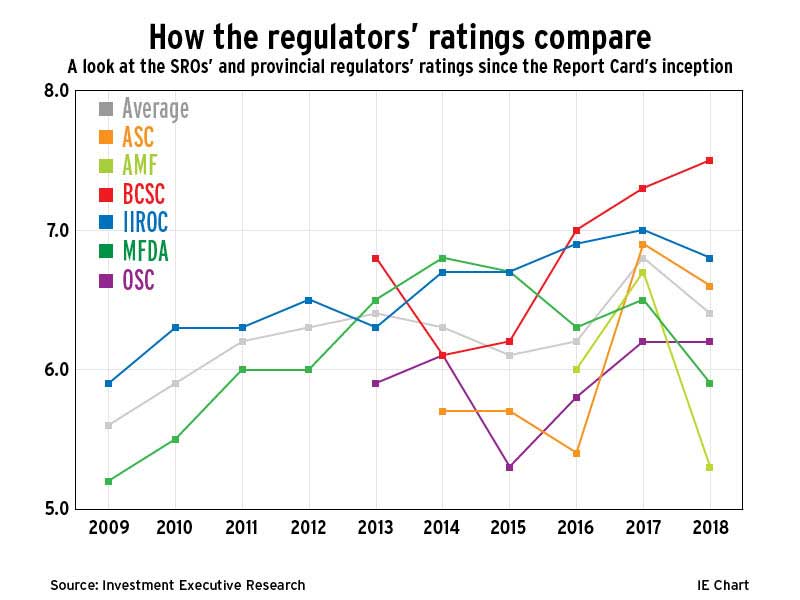
The regulators included in the Report Card have seen their share of ups and downs in the ratings during the past 10 years. This year, three regulators posted above-average IE ratings while three had below-average ratings. The BCSC had the highest IE rating of 7.5 in 2018. IIROC and the ASC also posted above-average ratings of 6.8 and 6.6, respectively. The remaining regulators have work to do as is evident from their below-average IE ratings. The OSC once again posted a below-average IE rating of 6.2 while the MFDA and the AMF both saw steep declines in their IE ratings this year to 5.9 and 5.3, respectively.
Those opinions come through in each regulator’s IE rating, which is the average of all the categories for which a regulator received a score on the Report Card’s main table. But while survey participants have at times been critical of the regulators, the mostly positive trajectory of the Report Card’s average IE rating over the past 10 years is a sign that things are improving.
The makeup of the Report Card’s main table itself has also changed over the years. More specifically, although the industry’s self-regulatory organizations (SROs) have been mainstays in the Report Card, the individual provincial regulators only began to appear in 2013. Prior to that, they were grouped together under the banner of “provincial regulators.”
View the slideshow to see how each regulator has have fared in comparison to the Report Card average since inception.