Overall, the average advisor at Canada’s mutual fund dealers reported modest gains in assets under management (AUM), stable client household numbers and slightly improved productivity (as measured by AUM/client household) this year. However, drilling down into the responses from individual firms exposes a lot more volatility in these metrics.
Dealers’ Report Card 2018: How each firm’s average advisor measures up
Dealers’ Report Card 2018: How each firm’s average advisor measures up
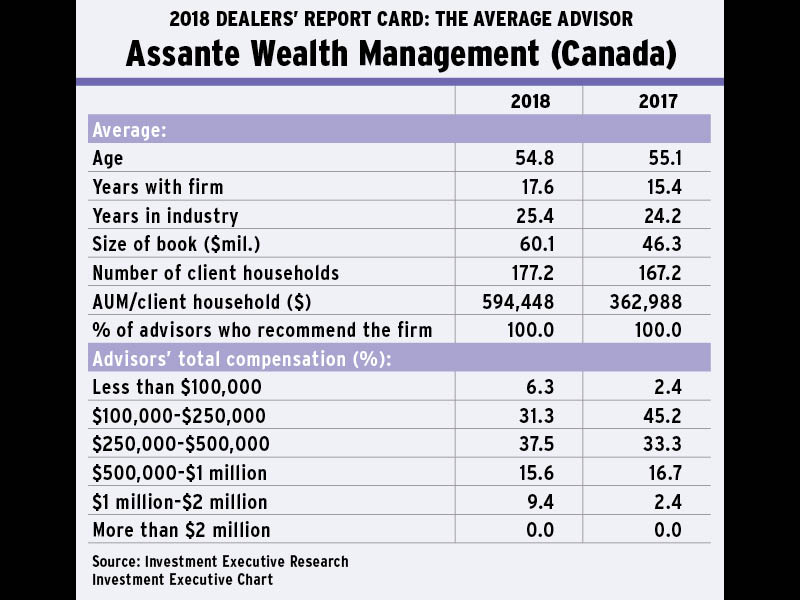
Assante Wealth Management (Canada)
Assante’s advisors already had some of the largest, most productive books of business in the industry, but that status was elevated further this year. The average Assante advisor surveyed for this year’s Dealers’ Report Card experienced a surge in AUM to $60.1 million from $46.3 million in 2017. At the same time, average AUM/client household was up impressively to $594,448 from $362,988 year-over-year.
Author: James Langton Source: Investment Executive Research Copyright: Investment Executive
Dealers’ Report Card 2018: How each firm’s average advisor measures up
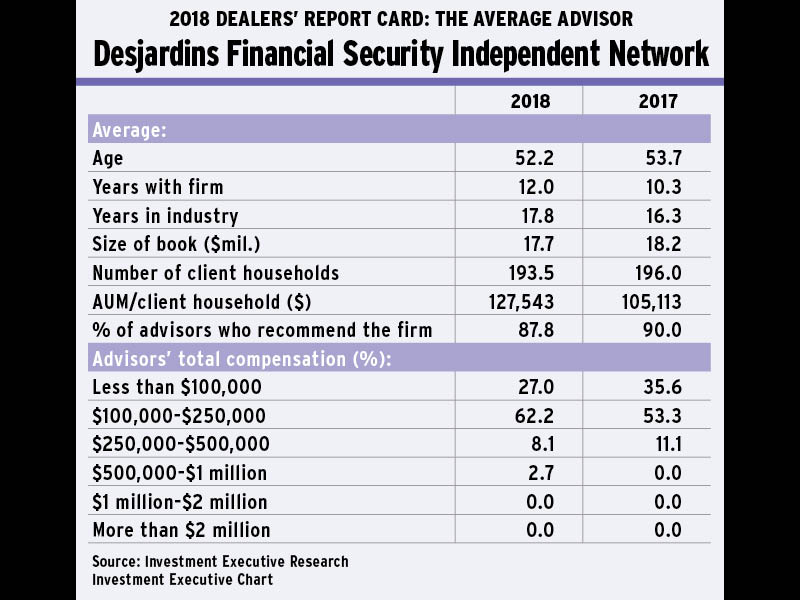
Desjardins Financial Security Independent Network
Average AUM and client household numbers were more or less unchanged among DFSIN’s advisors surveyed this year. Yet, amid a small increase in average productivity, the advisors surveyed reported an apparent tick up in their annual compensation, with the proportion of advisors making less than $100,000 a year declining to 27% this year from 35.6% in 2017.
Author: James Langton Source: Investment Executive Research Copyright: Investment Executive
Dealers’ Report Card 2018: How each firm’s average advisor measures up
Global Maxfin Investments
The sales force at Global Maxfin is skewing a little bit younger this year as the average advisor’s age dropped slightly to 56.5 from 57.1 year-over-over, as has the average advisor’s tenure in the industry. Amid this modest demographic shift, average AUM was essentially unchanged, but client household numbers were down a bit and average productivity was up compared with last year’s survey.
Author: James Langton Source: Investment Executive Research Copyright: Investment Executive
Dealers’ Report Card 2018: How each firm’s average advisor measures up
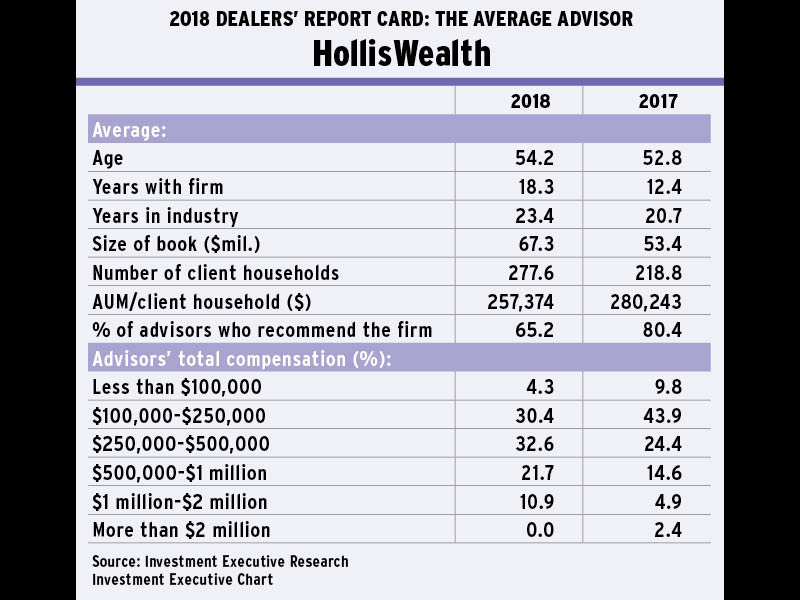
HollisWealth
The average HollisWealth advisor’s AUM was up notably, rising to $67.3 million this year from $53.4 million in last year’s survey. At the same time, average client household numbers were up as well. This resulted in average advisor productivity dropping to $257,374 from $280,243 in 2017. However, the proportion of advisors who would recommend the firm was down to 65.2% from 80.4% last year because of HollisWealth’s transition to new ownership under Quebec City-based Industrial Alliance Insurance and Financial Services Inc. from Bank of Nova Scotia.
Author: James Langton Source: Investment Executive Research Copyright: Investment Executive
Dealers’ Report Card 2018: How each firm’s average advisor measures up
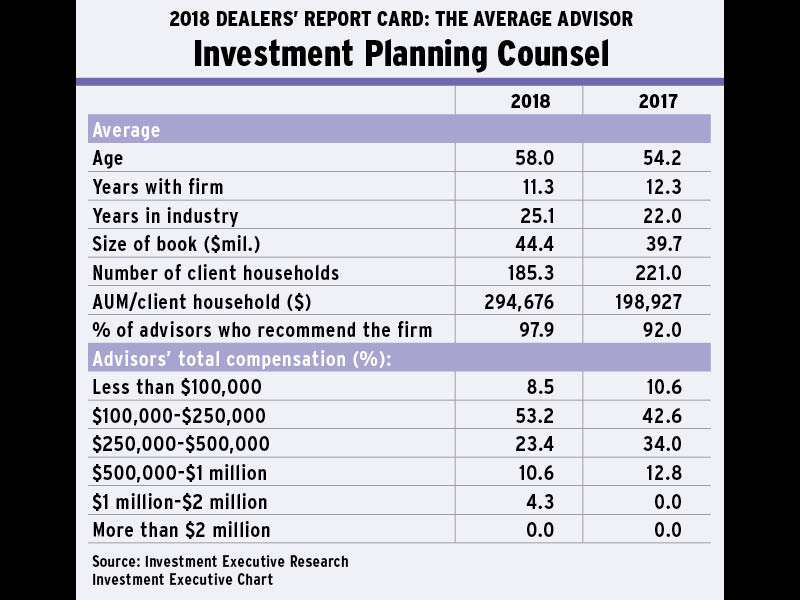
Investment Planning Counsel
The average IPC advisor reported a strong surge in productivity, with AUM/client household rising to $294,676 this year from just $198,927 in last year’s survey. The increase in productivity was a result of a combination of both an increase in average assets under management (AUM), to $44.4 million from $38.7 million, coupled with a notable drop in client household numbers, to 185.3 from 221.
Author: James Langton Source: Investment Executive Research Copyright: Investment Executive
Dealers’ Report Card 2018: How each firm’s average advisor measures up
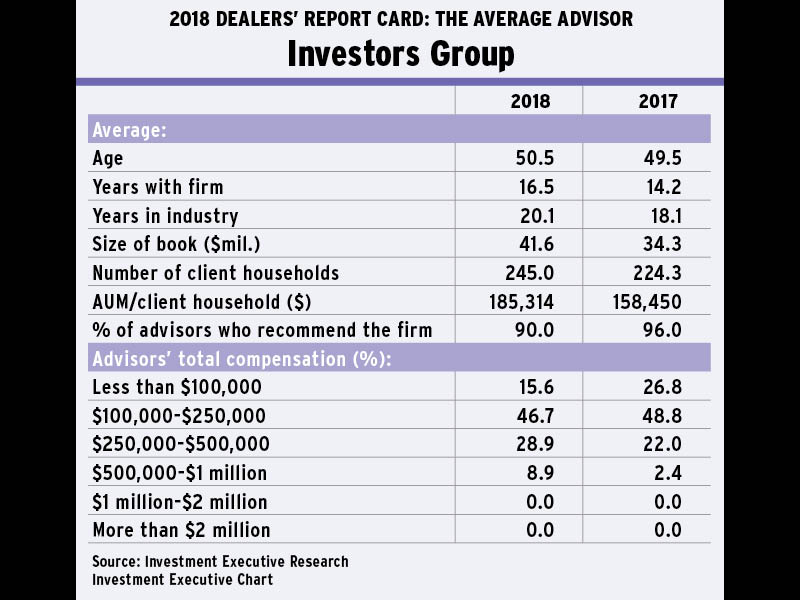
Investors Group
Compensation among Investors Group’s advisors appears to be on the rise, with the proportion of the lowest-paid advisors declining and the share in the highest-paid categories on the rise. This year, just 15.6% of the firm’s advisors reported earning less than $100,000 a year, down from 26.8% in last year’s survey. At the same time, 28.9% of Investors Group’s advisors said that they’re now earning between $250,000 and $500,000 a year, up from 22% in 2017. As well, the share of advisors who reported earning more than $500,000 has jumped to 8.9% this year from just 2.4% in 2017.
Author: James Langton Source: Investment Executive Research Copyright: Investment Executive
Dealers’ Report Card 2018: How each firm’s average advisor measures up
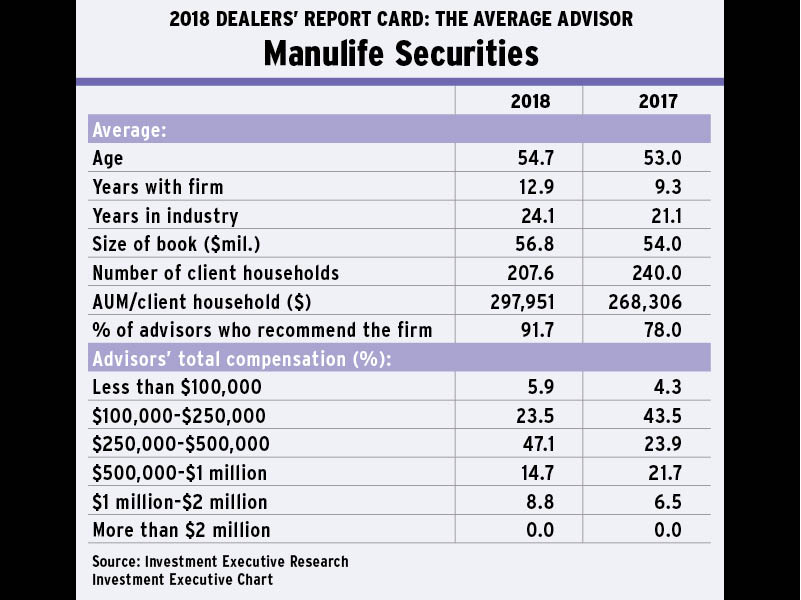
Manulife Securities
Despite little change in average AUM among Manulife Securities’ advisors, they’re enjoying an increase in average productivity, to $297,951 per client household from $268,306 last year. The fact that their reported client household numbers were down to 207.6 from 240 from last year suggests that Manulife Securities’ advisors are focusing their attention increasingly toward their higher net-worth clients, which is helping boost productivity.
Author: James Langton Source: Investment Executive Research Copyright: Investment Executive
Dealers’ Report Card 2018: How each firm’s average advisor measures up
Peak Financial Group
Peak’s advisors were one of the few sales forces that reported a decline in average AUM and productivity. Specifically, average AUM was down to $23.9 million from $30.3 million in last year’s survey while AUM/client household dropped to $151,719 from $181,345 in 2017. However, these trends likely reflect the underlying demographics of the advisors surveyed rather than a deterioration in their businesses as both the average age and tenure in the industry among these advisors was down notably year-over-year.
Author: James Langton Source: Investment Executive Research Copyright: Investment Executive
Dealers’ Report Card 2018: How each firm’s average advisor measures up
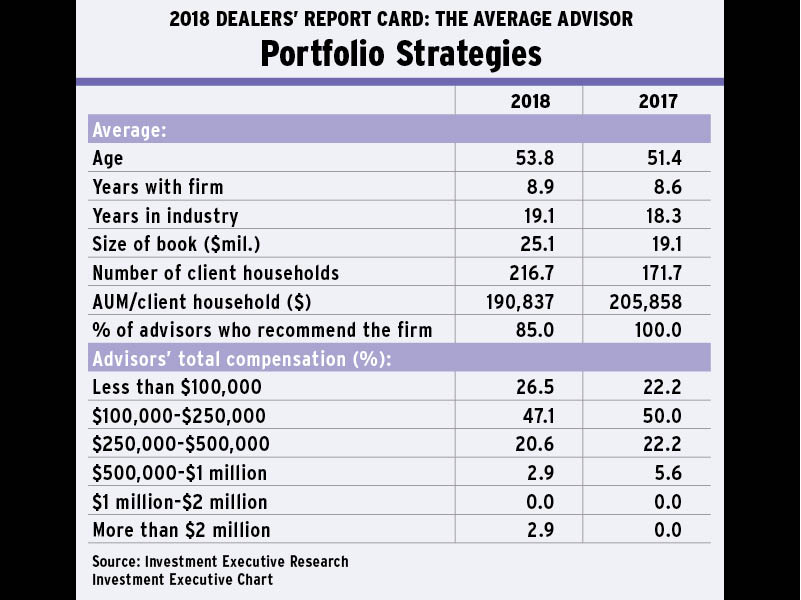
Portfolio Strategies
Average AUM was up impressively among Portfolio Strategies advisors, rising to $25.1 million this year from $19.1 million in 2017. However, these advisors also are serving more client households, which has resulted in a decline in average productivity despite robust gains in AUM.
Author: James Langton Source: Investment Executive Research Copyright: Investment Executive
Dealers’ Report Card 2018: How each firm’s average advisor measures up
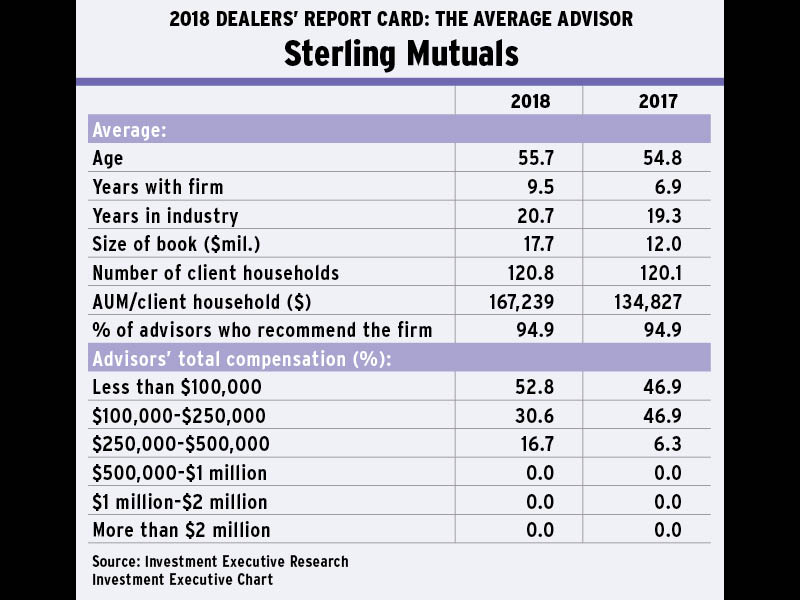
Sterling Mutuals
Compared with some advisors among the industry’s bigger firms, Sterling Mutuals’ advisors have relatively small books of business. Yet, they’re reportedly growing strongly. In fact, average AUM was up sharply this year to $17.7 million from $12 million in last year’s survey. At the same time, client household numbers remained unchanged, boosting average productivity impressively as well.
Author: James Langton Source: Investment Executive Research Copyright: Investment Executive
Dealers’ Report Card 2018: How each firm’s average advisor measures up
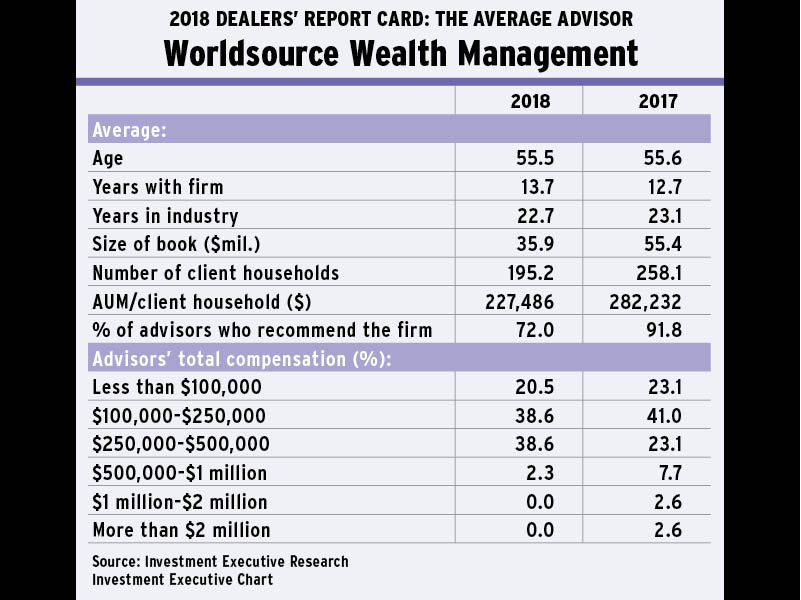
Worldsource Wealth Management
Worldsource’s advisors’ average AUM, client household numbers, productivity and satisfaction with the firm were all down markedly this year. Notably, average AUM dropped to $35.9 million this year from $55.4 million in last year’s survey. At the same time, client household numbers were down and productivity declined as well. Amid these negative trends, the proportion of Worldsource’s advisors who said they would recommend the firm has also dropped to 72% from 91.8% in last year’s survey.
Author: James Langton Source: Investment Executive Research Copyright: Investment Executive
In fact, the increase in AUM and improvements in productivity among some firms’ average advisors were relatively dramatic. This is evident among advisors with a couple of the bigger firms in the dealer channel — Assante Wealth Management (Canada) Ltd. and HollisWealth Inc., both based in Toronto — at which industry-leading AUM totals enjoyed strong growth, and at some of the smaller firms in the survey — Calgary-based Portfolio Strategies Corp. and Windsor, Ont.-based Sterling Mutuals Inc. — at which average AUM was up sharply, albeit from much lower starting points.
At the same time, there are also a couple of sales forces that reported a decline in these key metrics. In some cases, this may represent a shift in the underlying demographics at the firm, at which an influx of newer advisors with smaller, less productive books of business weighed on the average for the firm.
In addition, some of these changes also may reflect a difference in the sample population year-over-year. Indeed, it’s important to be aware that some volatility in these numbers — both positive and negative — is inevitable because of the relatively small sample sizes that result from breaking down the overall survey by firm.
View the slideshow to see how the average advisor for each firm compares.